
Mohamed Abdelkader
IIHR—Hydroscience & Engineering, University of Iowa
mohamed-abdelkader@uiowa.edu
HydroLearn
This module explains how IDF curves, rainfall forecasts, and exceedance probabilities support flood risk communication.
Forecasters often need to assess and communicate the risk of heavy rainfall to support real time decisions in flood forecasting and emergency response. A clear understanding of precipitation frequency analysis is important for turning rainfall data into useful information. This includes the development and use of precipitation frequency estimates and Intensity Duration Frequency curves (IDF). In operational settings, precipitation information is shared through Quantitative Precipitation Forecasts supported by products that show rainfall percentiles or Annual Exceedance Probability. These tools help explain how extreme a rainfall event is. This course provides the fundamentals needed to understand how IDF curves are generated and how they are used in operational hydrology.
This module equips operational hydrologists with the fundamental context needed for real-time forecasting during extreme rainfall events and for contributing to long-term planning and response efforts, with the flexibility to incorporate considerations of changing climatic conditions.
Precipitation statistics; Probability distribution; Exceedance Probability and Return Period; Depth-Duration-Frequency Curve; Stationary vs. Nonstationary; NOAA Atlas 14; NOAA Atlas 15; Access forecast rainfall; Access gauge rainfall.
Before starting this module, learners should have:
For foundational material, learners are encouraged to review the following HydroLearn modules:
At the end of this module, students will be able to:
This will be accomplished through a series of short readings on fundamental concepts, accompanied by learning activities in sections.
This module is broken down into sections with small units. Each section is self-contained and can be exercised individually.
IIHR—Hydroscience & Engineering, University of Iowa
mohamed-abdelkader@uiowa.edu

University of Hawaiʻi at Mānoa
tsangy@hawaii.eduOperational hydrologists and forecasters
Computer with access to Internet and basic programming knowledge in python.
The module developers estimate that this module will take between 2 to 3 hours to complete.
This course is available for export by clicking the "Export Link" at the top right of this page. You will need a HydroLearn instructor studio account to do this. You will first need to sign up for a hydrolearn.org account, then you should register as an instructor by clicking 'studio.hydrolearn' and requesting course creation permissions.
Abdelkader, M., Tsang, Y. (2025) Precipitation Frequency and Storm Analysis in Operational Hydrology. CIROH. https://edx.hydrolearn.org/courses/course-v1:CIROH_HydroLearn+OP_020+2025/about.
This module is adapted from:
Habib, E. (2020). Development of Design Storms. HydroLearn. https://edx.hydrolearn.org/courses/course-v1:HydroLearn+HydroLearn414+2020_S2/about.
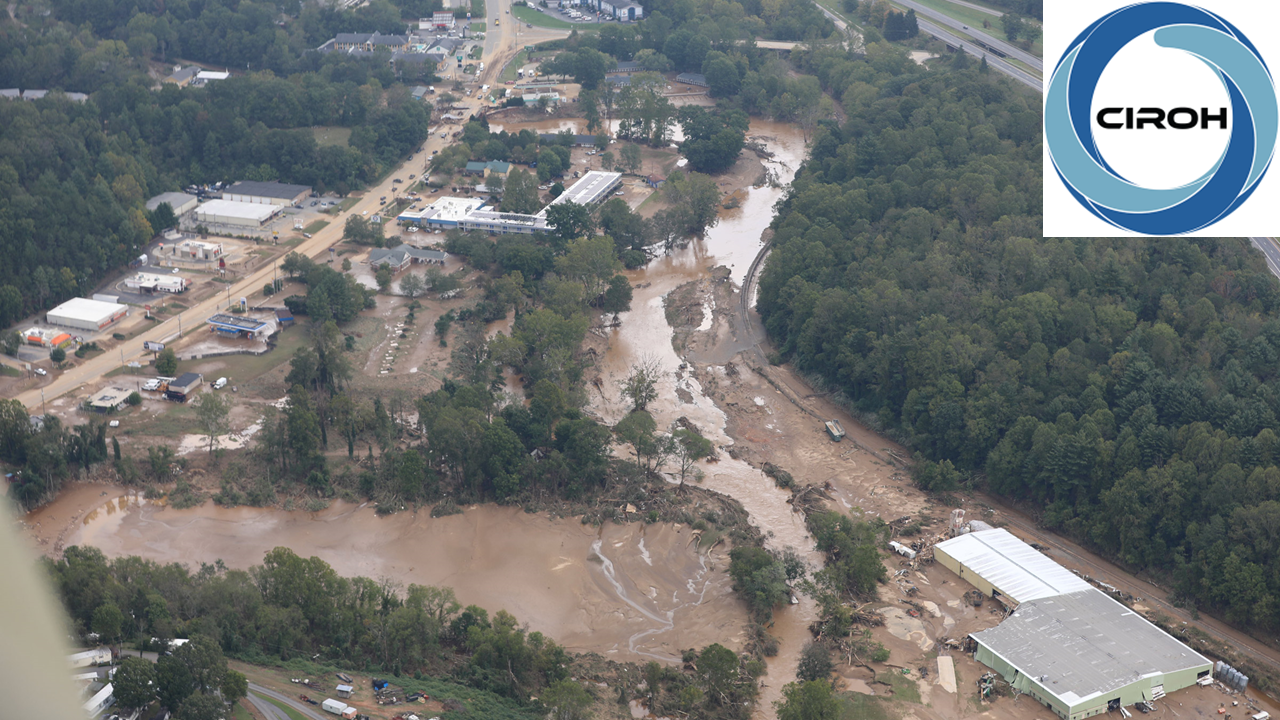
Adaptations include utilizing Python Jupyter Notebook to allow a streamlined process in the learning activities and using Hurricane Helene as a case study with datasets from Asheville, NC provided by the National Weather Service (NWS).
This experimental data represents the NWS’s best approximation of the maximum inundation extent that occurred on Sep. 26 (or Sep. 27), 2024, as of Jan 6, 2025, based upon modeled river discharge. These maps were not publicly available during the event (coinciding with Hurricane Helene). This information should be used for educational purposes only.
This project received funding under award NA22NWS4320003 by National Oceanic and Atmospheric Administration (NOAA) Cooperative Institute Program to the Cooperative Institute for Research on Hydrology (CIROH) through the University of Alabama. The statements, findings, conclusions, and recommendations are those of the author(s) and do not necessarily reflect the opinions of NOAA.