
Landon Marston
lmarston@vt.edu
virginiatech
The course is designed to first introduce you to key concepts in probability theory and statistics as they relate to hydrologic analyses. Then you will be led through a case study of the John's Creek streamgage located in New Castle, Virginia, in which you will perform a flood frequency analysis and subsequent culvert design scenario.
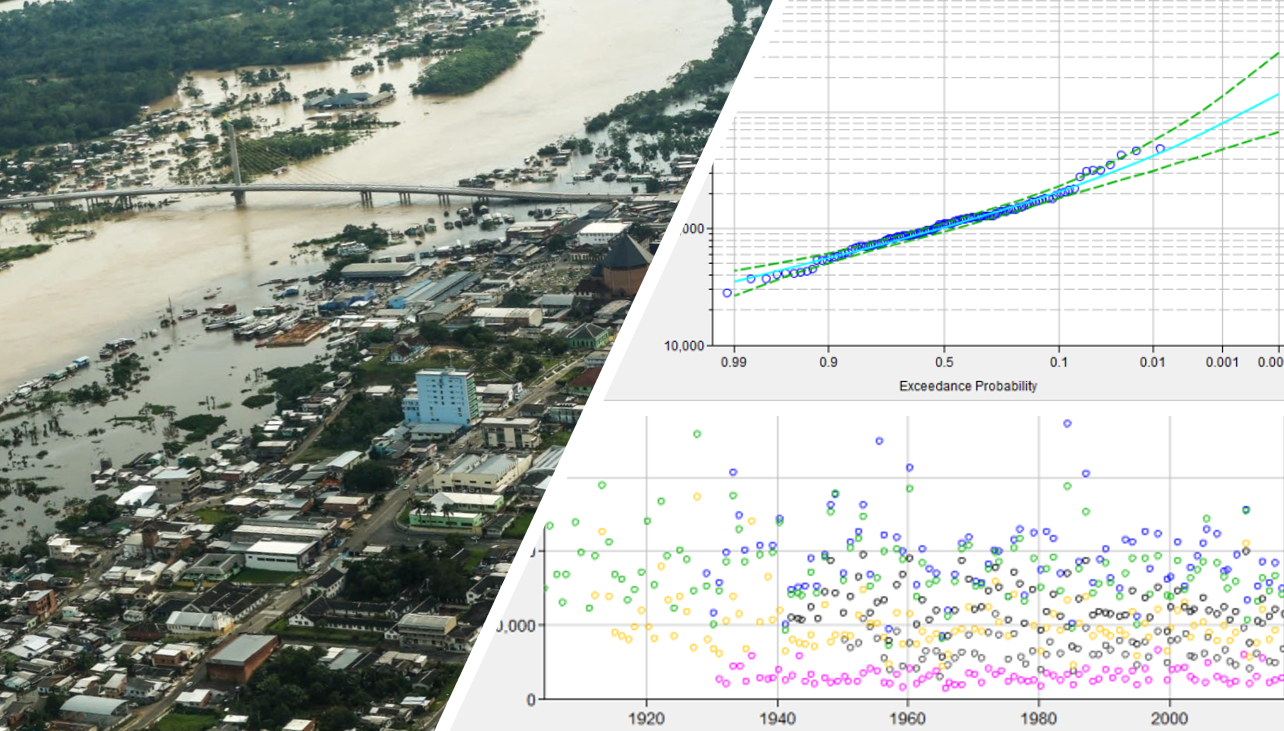
Located near the Jefferson National Forest in Virginia, John's Creek is a mountain stream that is popular for recreation and kayaking. The stream also runs through New Castle, Virginia, a small rural town with a population of about 200 people (US Census, 2019). The location of the streamgage sits under a small bridge, where it has been determined that a large culvert should replace the current structure due to flooding concerns. You have been tasked by the Town of New Castle and Craig County to determine the necessary capacity of this new culvert by performing a flood frequency analysis. The resulting culvert should be able to carry the design flood safely while also remaining as economical as possible.
To design this new culvert, you will first need to understand the basics of probability theory and stochastic analysis in hydrology. Then the module will walk you through the steps of frequency analysis and how such an analysis can be helpful in water resources design and hydrologic studies. Finally, using USGS streamgage peak flow data from the John's Creek Streamgage location, you will perform a flood frequency analysis to choose a culvert design that can carry the required design flood and is both safe and economical for the town.
Probability Theory, Statistics, Frequency Analysis, Flood Frequency Analysis, Low Flow Frequency Analysis
To take this course, will find it helpful to have a basic understanding of probability and statistics and an interest in water resources and hydrology.
At the end of this module, students will be able to: source and interpret time series of hydrologic variables, explain how concepts of probability and statistics apply to hydrologic studies and frequency analysis, and perform a full flood frequency analysis using 'by-hand' methods and industry specific software.
"This will be accomplished through activities within each section. Results from each activity will be recorded in specified results templates. The results templates for each activity can be found at the beginning of each activity. The results templates are organized such that results from one activity can easily be used in successive activities."
lmarston@vt.edu

mohammadyunusn@vt.edu
If you are an Instructor seeking the answer keys, please contact the course creators using your official University email account.
Junior or Senior Civil or Environmental Engineering Students interested in Water Resources
HEC-SSP 2.2, Spreadsheet Application (Google Spreadsheets or MS Excel), Document Editor (Google Documents or MS Word).
This course is available for export by clicking the "Export Link" at the top right of this page.
Marston, L., Naseri, Y. (2021) Frequency Analysis in Hydrology. HydroLearn. https://edx.hydrolearn.org/courses/course-v1:virginiatech+CEE4304+2021_SP/about
The module developers estimate that it will take a total of 15-20 hours to complete the module.