Dr. Hilary McMillan
Associate Professor, San Diego State University
hmcmillan@sdsu.eduSDSU_UF
This module exposes students to quantitative and graphical analysis of hydrologic droughts with a focus on rivers and streams.
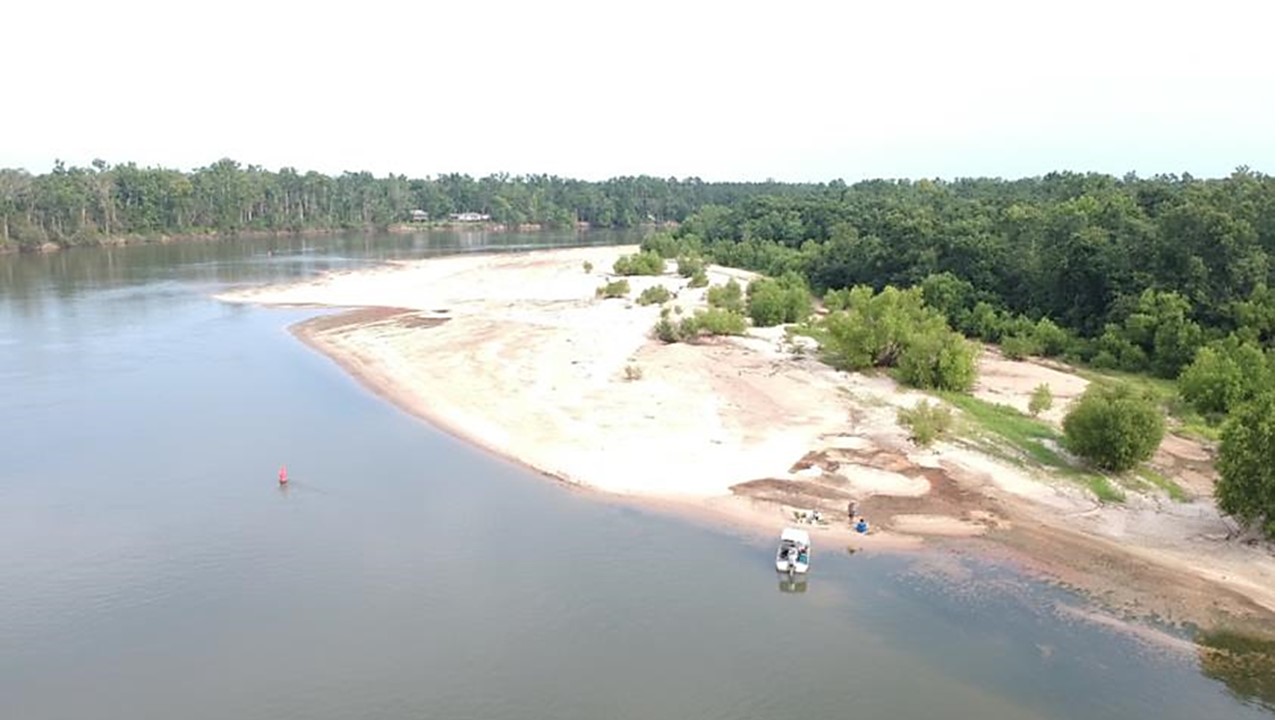
Hydrologic drought refers to a deficit of water in one or more components of the hydrosphere, resulting in abnormally low streamflow in rivers and streams and low levels in lakes, reservoirs, and groundwater. Although physical factors such as climate and weather variations are typically the primary causes of droughts, anthropogenic factors such as irrigation, land use, reservoir-building, and diversions or extractions of water can also cause or exacerbate droughts. As a result, hydrologic droughts are becoming increasingly common due to both climate change and anthropogenic stressors.
In this module, we examine droughts but focus primarily on droughts in rivers and streams. First, we give background to droughts in terms of presenting definitions of the types of droughts, what is and is not a drought through case studies, examine concepts such as magnitude, frequency, and duration of droughts and their interactions, and examine the role of anthropogenic factors and hydrologic droughts. Second, we examine a variety of drought indices used in different situations and apply real-world data to the calculation of drought metrics. Next, we use streamflow data to examine hydrologic droughts through the use of flow and dimensionless flow duration curves. Students then learn strategies to communicate information about hydrologic droughts by adapting the climate stripes method to create "streamflow stripes" and create stream-flow heat maps to show changes in long-term annual and monthly averages of streamflow. Finally, students communicate about a hydrologic drought situation using their graphics and narration through role-playing as a water manager to various stakeholders.
This module exposes students to quantitative and graphical analysis of hydrologic droughts with a focus on rivers and streams. We introduce students to hydrologic indices and indicators used by the federal government regarding drought or low flow conditions in streams. Students apply e-flows software and become familiar with other software useful for assessing drought including Excel and IHA (indicators of hydrologic Alteration). Then, they use flow duration curves and dimensionless flow duration curves to assess long-term change associated with river regulation or other drivers. We visualize drying streams with Excel-derived colorful graphics called stream-flow stripes and stream-flow strips or "heat maps" of annual and monthly data. Ultimately, students synthesize this information into a case study of a drying stream or streams to educate and inform stakeholders about water stewardship. These activities are relevant to students interested in careers in water monitoring, management, sustainability, and conservation.
Concepts: Types of droughts; frequency, magnitude, and duration of droughts; drought indices; flow regimes; flow duration curves; human impacts on streamflows; ecodeficits and ecosurplus
Skills: Download USGS streamflow data; calculate drought indices using streamflow data; interpret and develop flow duration curves; create graphics showing changes in low flows; create a presentation on changes in river flows
No prerequisites, but some familiarity with spreadsheets is helpful.
Learning Outcomes Given a watershed, students will be able to find and download streamflow data. Students will gain skills in online flow analysis software and in using spreadsheets for flow analysis. Students will be able to apply a variety of metrics to analyze changes in low flows and droughts. Students will apply a variety of visualization techniques to communicate changes in low flows and droughts to stakeholders.
At the end of this module, students will be able to: 1) define whether the situation is a meteorological, agricultural, hydrologic or societal drought; 2) evaluate the concepts of magnitude, frequency and duration as pertains to hydrologic droughts; 3) find, download, and prepare data sets to calculate low flow indices by hand and using the eflows online tool, and use the indices to analyze low flows in a watershed of their choice; 4) communicate results of streamflow analyses in a short report using clear, scientific writing style; 5) manipulate, graph and analyze hydrologic data to distinguish changes to the flow regime using stage and streamflow data; 6) design a communication and visualization strategy of drought and water scarcity which informs stakeholders regarding water concerns such as worsening or impending droughts based on long-term data in a river or set of rivers
This will be accomplished through activities within each section. Results from each activity will be recorded in specified results templates. The results templates for each activity can be found at the beginning of each activity. The results templates are organized such that results from one activity can easily be used in successive activities.
Associate Professor, San Diego State University
hmcmillan@sdsu.eduProfessor, University of Florida
mossa@ufl.eduThis module is designed for Junior/Senior students in the Earth and Environmental Sciences.
Students will use spreadsheets such as Google Sheets and Excel, as well as presentation software such as Power Point
This course is available for export by clicking the "Export Link" at the top right of this page. This course can cited as follows:
McMillan H., Mossa, J., (2020). Hydrologic Droughts and Drying Rivers. HydroLearn.https://edx.hydrolearn.org/courses/course-v1:SDSU_UF+Drought1+Fall2020/about
If you are an Instructor seeking the answer keys, please contact the course creators using your official University email account.
The module developers estimate that this module will take between 20 and 30 hours to complete.