Problem Statement
You are a water resources scientist tasked with improving water quality monitoring in Georgica Pond. You have access to remote sensing data, in-situ measurements from an autonomous buoy, and advanced data analysis tools such as Google Earth Engine and Jupyter Notebook. Your goal is to assess the severity of the waterbody using different inputs to inform and recommend water quality monitoring in Georgica Pond, East Hampton, NY. You are asked to create a presentation, record and upload it for review by the state water board members summarizing your findings.
Module Overview
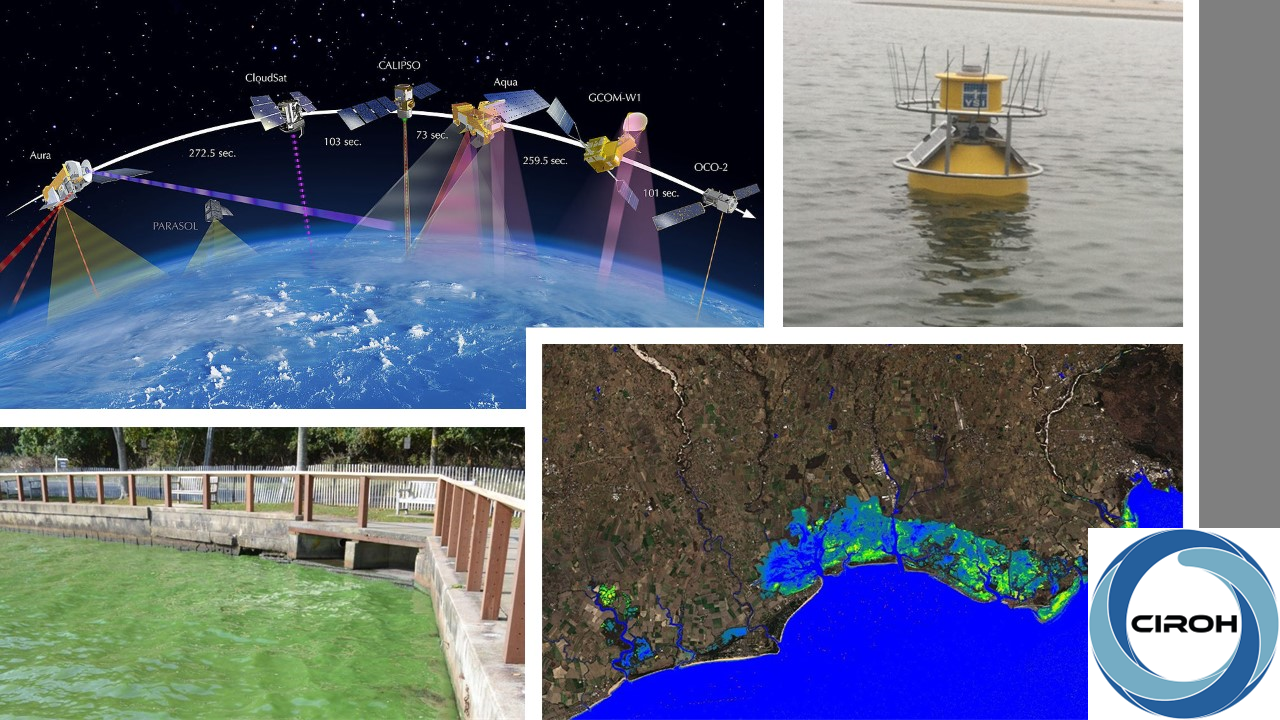
For over a decade, Georgica Pond (Figure 1.1) has suffered from toxic cyanobacteria blooms, or blue-green algae, during the summer months. In 2012, a dog died after exposure to the pond water. A necropsy revealed high levels of cyanotoxins in the dog's stomach that led to neurotoxic shock and eventual death. Testing in the summers thereafter revealed high levels toxic algae leading local government officials to close the pond to shell fishing and recreation. Harmful algal blooms (HABs) such as cyanobacteria can thrive in warm, nutrient rich waters. These closures have had negative impacts on many including summer visitors and local residents, who consider the pond an integral feature of their community. This module covers the fundamentals of remote sensing for water quality monitoring, in addition to high frequency buoy data for assessing chlorophyll a levels. Students will learn key concepts, data analysis techniques, and practical applications to assess water quality of a coastal lake in East Hampton, NY.
Topics Covered
HABs Basics and Monitoring using buoy
Remote Sensing and Chlorophyll a estimation
Management of Algae in Aquatic Ecosystems
Prerequisites
Basic home computing skills, including Microsoft Office suite. Basic data analysis.
Learning Objectives
At the end of this module, the students will be able to (a) Define key terms related to chlorophyll a data monitoring and analysis. (b) Describe the importance of data cleaning and aggregation. (c) Summarize the process of establishing a regression model to fit the buoy data using in-vivo data. (d) Analyze the relationship between in vivo data and buoy data using regression analysis. (e) Integrate multiple data sources (time series and spatial tiff files from remote sensing data) to create a comprehensive analysis of chlorophyll a levels. (f) Develop a presentation to communicate findings and recommendations effectively. (g) Evaluate the accuracy and reliability of different data sources and methods. (h) Formulate evidence-based recommendations for managing chlorophyll a levels.
Suggested Implementation
It is a self learning module and students are encouraged to reach out to the instructors in case of doubts.
Course Authors
Sushant Mehan
I work at water resources engineering and hydro-informatics interface. My research agenda includes advancing the understanding and physical representation of nutrients' fate and transport to manage water resources using the computing infrastructure. I am also interested in exploring how interactions between climate and land management operations impact water quantity and quality. My passion for working on water resources, precisely water quality, is driven by the idea that resolving water problems can solve much unseen unpredicted chaos in the ecosystem. I love to work as a problem solver on issues related to water sustainability.
Email Address: Sushant.Mehan@sdstate.edu
Ryan Wallace
Ryan Wallace, PhD, assistant professor in the Department of Environmental Studies and Sciences, has received a federal grant to tackle the threats acidification and harmful algal blooms pose to Long Island Sound ecosystems and organisms.
Email Address: rwallace@adelphi.edu
Target Audience
The target audience is undergraduates enrolled in natural resources and environmental science, water resources, and/or fisheries and aquatic sciences with specific focus on water quality.
Expected Effort
The module developers estimate that this module will take between 10 to 15 hours to complete.
Course Sharing and Adaptation
This course is available for export by clicking the "Export Link" at the top right of this page. You will need a HydroLearn instructor studio account to do this. You will first need to sign up for a hydrolearn.org account, then you should register as an instructor by clicking 'studio.hydrolearn' and requesting course creation permissions.
Recommended Citation
Mehan, S. and Wallace, R., (2024) Real-time spatial-temporal assessments of Harmful Algae Blooms (HABs). CIROH. https://edx.hydrolearn.org/courses/course-v1:AdelphiUniversity+ENV110+2024_T1/about
Review
Submitted: 8/19/2024
Approved: 1/16/2025
Acknowledgement
This project received funding under award NA22NWS4320003 from NOAA Cooperative Institute Program. The statements, findings, conclusions, and recommendations are those of the author(s) and do not necessarily reflect the views of NOAA.